

At midnight on January 1st 2019, the first city in Scotland was Glasgow to set up a Low Emissions Zone (LEZ). This LEZ covers the city centre, with 20% of all buses in the city having to meet the European Union (EU) emissions standards during the first phase. By 2022 all vehicles entering the zone will need to be fully compliant with the standards.
The European Economic Area Executive Director, Hans Bruyninckx, has stated “Air pollution is causing damage to human health and ecosystems”. I would have therefore thought that since the announcement by the First Minister Nicola Sturgeon in October 2017 that Glasgow would have a Low Emission Zone, the Scottish Government would have been congratulated for taking positive action to reduce air pollution.
But anyone reading some news media might get the impression that the reverse was true. In March 2018 The Guardian headline “Plan to cut Glasgow air pollution is a failure, say campaigners”, The Herald headline “Glasgow’s new low emissions zone will condemn city to illegal air for years”, while the BBC reported in October that “Glasgow more polluted than London” according to the World Health Organisation (WHO).
To be fair, most of the press were quoting from statements made by the Friends of the Earth, who in June 2018 had the headline “Don’t believe the hype – Glasgow’s Low Emission Zone proposals are not progressive”. On the third of January 2019 Airqualitynews.com reported “Glasgow’s LEZ comes into force”. In the article, Gavin Thompson of Friends of the Earth “criticised the phased nature of the LEZ, saying it will only require an improvement in a ‘tiny’ number of buses to meet the first year’s target”.
The average member of the public could easily be mistaken into believing that an LEZ is a bad thing, or that Glasgow is the most polluted city in the UK or even Europe. So, what is the truth behind the headlines? I started my investigation by looking at the consultation document “Building Scotland’s Low Emission Zones”. This consultation opened at the beginning of September 2017 and closed at the end of November 2017. The consultation gave any individual or organisation, including Friends of the Earth, the opportunity to respond and contribute to the proposals. There was a total of 967 responses, which I assumed helped with the design of LEZ in Scotland.
So, how bad is the traffic atmospheric pollution in Glasgow city? Well, according to Friends of the Earth in 2017 they stated “Once again, streets in Scotland have dangerous levels of toxic air pollution which are breaking legal limits. The situation across Scotland is potentially showing some slow signs of improvements, but filthy streets continue to poison our lungs nearly a decade after a legal deadline.”
What is Traffic Pollution
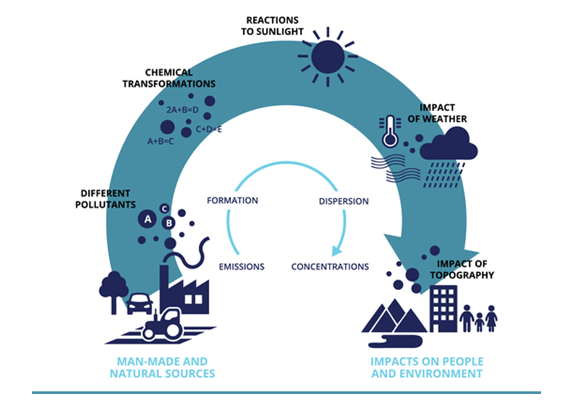
So, what is traffic pollution and what are the chemicals that cause pollution. The main pollutants are nitrogen oxides (NOx) created from oxygen and nitrogen reacting during vehicle engine combustion. If the combustion process of the vehicle fails to burn all the fuel, then carbon monoxide (CO) is produced. Small particulate matter is also produced during combustion. These can be trace elements, soot particles or other organic compounds.
During warm weather, energy from sunlight can react with NOx in the atmosphere, reversing the reaction caused by the high temperatures of vehicle combustion. This releases very reactive oxygen atoms (O), which then combine with oxygen molecules (O2) in the atmosphere to form ground level ozone (O3).
Nitrogen oxides consist of different compounds of oxygen and nitrogen. The most toxicologically significant are nitric oxide (NO) and nitrogen dioxide (NO2). In unpolluted areas, NO concentrations are only a small fraction compared to NO2. But in towns where the oxidising capacity of the atmosphere may be limited, NO concentrations can exceed NO2. High levels of these compounds can damage plant life and respiratory problems in humans.
When carbon monoxide is breathed in, it enters the blood stream and mixes with haemoglobin, preventing the blood from carrying oxygen to the body’s cells.
Particulate matter is normally identified as PM10 or PM2.5, the number represents the maximum size of the particle 10μm and 2.5μm respectively. Both sizes of particle are a health hazard as they can enter the respiratory system, causing acute and chronic bronchitis and asthma.
I visited the Air Quality in Scotland website to try to obtain some true facts. This website has been set up by Ricardo plc, a global strategic engineering and environmental consultancy, specialising in the transport, energy and scarce resources sectors. They manage the website on behalf of the Scottish Government to provide the public with live information regarding Scotland’s air quality. Their database records date back to 1986, containing measured concentration data and statistics from sites operated by DEFRA, the Scottish Government and Local Authorities. Their latest pollution map shows the pollution levels across Scotland for O3, CO, sulphur dioxide, NO2, PM10 and PM2.5. I checked Glasgow on the 7th January 2019 at 9:55 AM, just after the Glasgow rush hour, when traffic pollution should have been at its highest levels.
| Site | Pollutant | Band | Concentration | Period |
|---|---|---|---|---|
| Great Western Road | Nitrogen dioxide NO2 | Low (1) | 5 μg m-3 | Hourly mean |
| Great Western Road | Nitrogen oxides NOX as NO2 | not app | 15 μg m-3 | Hourly mean |
| Great Western Road | Nitric oxide NO | not app | 7 μg m-3 | Hourly mean |
| Townhead station | Ozone O3 | Low (2) | 45 μg m-3 | 8 hour mean |
| Townhead station | Particulate matter PM2.5 (hourly) | Low (1) | 8 μg m-3 | 24 hours mean |
| Townhead station | Particulate matter PM10 (hourly) | Low (1) | 11 μg m-3 | 24 hours mean |
| Townhead station | Nitrogen dioxide NO2 | Low (1) | 20 μg m-3 | Hourly mean |
The records show that pollution levels in Glasgow on the 7th January were low, with an index of 1 or 2. The pollution index is:
| Low | Moderate | High | Very high |
|---|---|---|---|
| 1, 2, 3 | 4, 5, 6 | 7, 8, 9 | 10 |
There are numerous pollution monitoring sites across Glasgow, with 19 monitoring stations at urban roadsides or kerbsides. The website also shows a summary of the annual mean trends between 2007–2016. The traffic related urban sites within Glasgow show a downward trend in NO2 concentration between these years.

Glasgow Compared with other European Cities
So how does Glasgow compare with other cities in Europe? To find out, I visited the European Air Quality Index on the 7th January 2019. This site has GIS interactive maps maintained by the European Environment Agency. The Air Quality Index allows users to understand the air quality across Europe with up-to-the-minute data.
| City | Good | Fair | Moderate | Poor | Very poor |
|---|---|---|---|---|---|
| Glasgow High Street | 10.1% | 81.8% | 7.1% | 1% | no record |
| London Marylebone Road | no record | 10.1% | 57.6% | 25.3% | 7.1% |
| Netherlands Utrecht-GriftPark | 21.3% | 48.9% | 14.9% | 11.7% | 3.2% |
| Belgium Antwerp | 4.0% | 43.0% | 27.0% | 26.0% | no record |
| France Paris | 5.1% | 45.5% | 20.2% | 23.2% | 6.1% |
| Germany Berlin | 5.2% | 40.2% | 36.1% | 18.6% | no record |
If Glasgow is no worse than other cities in Europe, what about the BBC news article above? Well, the article headline is based on the claim that the WHO said Glasgow 16 μg m-3 of particulate matter while London and Leeds only had 15 μg m-3. But air pollution is not a simple case of comparisons, as the BBC have implied. Air pollution depends on the types of emissions and emission sources, both natural and anthropogenic.
The formation of pollutants can depend on chemicals available, weather conditions, landscape, or amount of sunlight. The level of pollution can change on any day or even hourly. Without knowing more information about these values, they are meaningless. Are they point recordings or mean values over time? If they are mean values, then what timescale? What was the weather in Glasgow over that period, and how did it compare to London or Leeds? Is a value of 15 μg m-3 compared to 16 μg m-3 statistically significant?
The European Directive has set out limits and target values for pollutant levels to ensure the protection of human health. These limits are listed in the National air quality objectives available from the Department for Environment Food & Rural Affairs website. The limits are based on a dose-response relationship for toxicity testing. The investigation is carried out to determine the median concentration of the chemical substance that produces a response in 50% of the test population after a measured time interval. The test population may be rats, mice, fish insects, plants or other organisms. The findings are termed the lethal dose LD50, effective dose ED50 or toxic dose TD50 depending on the response produced. The results can then be used to establish safe limits once a suitable factor of safety has been applied.
It seems that Glasgow is not as bad as the media may have has suggested. Perhaps it is understandable that the media want to attract more readers to their publications, and using provocative headlines such as “Glasgow’s new low emissions zone will condemn the city to illegal air for years” is an effective way of achieving this. One of my concerns is that environmental pressure groups such as Friends of the Earth, while trying to draw public attention to environmental risks and apply pressure on politicians to clean up the environment. They are creating unnecessary anxiety and emotional fear amongst many less well-informed people. While I appreciate the health issues with traffic pollution, but I can also see that some hype could increase mental problems with vulnerable individuals.
